The classification of the pixels that compose a remotely-sensed raster image into land use/land cover categories- such as forest/trees, grass, buildings/roads, etc.- is primarily accomplished via "supervised" or "unsupervised" classification processes. "Supervised" classification involves the creation of categories of land use/cover, and subsequent assignment of image pixels to each category, mainly by way of manual determination by an image analyst. "Unsupervised" classification, on the other hand, begins with a computer algorithm assignment of image pixels into a pre-defined number of class types, and a subsequent determination by an analyst what each class represents and whether the computer-assigned classes for the pixels are accurate.

The above image includes five feature class types, with each pixel assigned to each class by the computer algorithm, which clusters pixels according to their number values in each band layer. The algorithm initially produced 50 different classes, which were then manually condensed into the five seen above. The total surface area for each class was then calculated, and the impermeable and permeable surface areas as well.
The plethora of earth's physical features that can be identified by way of multi-spectral, remotely-sensed images is endless. Different band (wavelength) combinations, and display of specific bands symbolized in unique ways, allow for all manner of object identification. "False color" band combinations, for instance, can be used to detect areas of normal and abnormal vegetative growth- identified by the way in which these areas absorb and reflect different wavelengths of radiation.
The above image, using Landsat ETM+ thermal band 6, allows for the identification of forest fires- depicted as bright yellow pixels in the north-east quadrant of the image. Band 6, the thermal infrared (IR) layer of the multi-spectral image, can be "stretched" along a color ramp, such that the "coolest" (lowest) pixel values are at one end of the spectrum, and those highest ("warmest") values are at the other extreme. The colors in this image are stretched in a manner that conveys the warmest portions of this remotely-sensed area (the parts that are literally on fire) are displayed as an entirely different color than the other (non-burning) parts of the area- making the fires immediately visible within the landscape.
Feature identification in aerial photography and other remotely sensed images is primarily aided by the use of multiple spectral bands, from which features on the earth's surface are classified by comparing and contrasting the information found in each band. Red, green and blue visible electromagnetic radiation (EMR), combined with infrared and near-infrared band layers, all combine to form a multi-spectral snapshot of an area, the radiometric display of which can be manipulated in endless ways.
Some of the ways the multiple spectral bands can be displayed, in order to highlight specific physical features, are depicted in the above graphic. Three different features are identified by way of their spectral characteristics in each spectral band layer- primarily the pixel brightness in each layer of the multiple bands. The pixel values (brightness) in each spectral band layer provide a means of feature classification by way of pixel value comparison across the layers.
While making educated interpretations of land use and cover from remotely-sensed images is all well and good, it is important to consider the fact that some classifications are bound to be erroneous. User error is endemic to any variety of image interpretation, and to any application of human interpretation of anything, really. How we classify and interpret these errors is of the utmost interest to any G.I.Scientist.

The above aerial image, which was previously classified by land type and use, has been sampled for accuracy in the above map. The sample points were placed within the squares of an overlaid grid, and allow for a spatially-systematic examination of the classification accuracy. This (very simplified) error measurement is a "quick and dirty" method of examining the land classification, and forgoes a lot of the nuances and details produced by an error matrix with attendant measures of producer's and user's accuracy. The relatively uniform spacing and placement of sample points in this assessment may also leave out some of the detailed differences in accuracy between classification categories.
One of the cornerstones of aerial imagery interpretation is arguably the classification of land use and land cover derived from these images. Large swathes of the world can be accurately mapped, with designations for what the land is used for and/or what the land's natural surface is covered with, using methods of aerial imagery classification. These methods mainly rely on the ability of trained interpreters to accurately identify natural and man-made features in a remotely-sensed image.
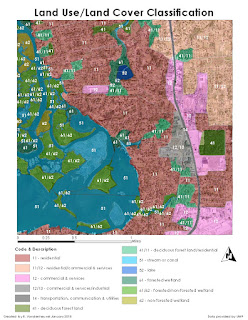
The above image represents land use and land cover classification from an aerial image, using characteristics like color, texture, pattern, shape and association of the various land types and physical features therein. The squares in the photo, for instance, are obviously buildings, and the green-colored, characteristically shaped/textured areas are obviously trees. The challenge really begins at deciding which buildings are houses, and which are commercial areas, or which trees are deciduous, and which are evergreen. This is where the tools gained from experience and/or training allow the interpreter classifying the image to really identify the specific land uses and covers within the aerial image.


